Fiscal Policy and Economic Growth: Government's Unique Situation
Government's Unique Situation
As you know, if any element of the C + I + G + (Ex - Im) formula increases, then GDP—total demand—increases. If the “G” portion—government spending at all levels—increases, then GDP increases. Similarly, if government spending decreases, then GDP decreases.
When it comes to financial management, four characteristics of the government set it apart from households and businesses (the “C” and “I” in the formula):
EconoTip
The interest rate on U.S. bonds is considered the risk-free interest rate because there is no credit risk associated with them. There is, however, the risk of inflation. Therefore, the rate on a government security represents the price to “rent” that money for that period of time with the certainty that it will be paid back, plus any inflation premium.
EconoTalk
The tax base in a nation, region, state, or city is the number of workers and businesses who can be taxed. The term usually refers to income taxes, but in the case of states and cities, it also refers to sales and property taxes.
Bracket creep occurs when inflationary pressure increases wages and pushes a worker into a higher tax bracket. This puts a “double whammy” on the worker, who loses purchasing power—wage-push inflation often increases prices faster than wages—and pays more in taxes. But it helps keep inflationary pressures under control.
- Government has the power to tax, which gives it greater control over its revenue. Federal, state, and local governments can mandate higher taxes and increase their revenues. Households and businesses have the more difficult task of selling their labor, goods, and services in order to raise revenue.
- By increasing or decreasing taxes, the government affects households' level of disposable income (after-tax income). A tax increase will decrease disposable income, because it takes money out of households. A tax decrease will increase disposable income, because it leaves households with more money. Disposable income is the main factor driving consumer demand, which accounts for two-thirds of total demand.
- The federal government can finance budget deficits by borrowing in the financial markets. Investors consider U.S. government bonds to be risk free, because they are backed by the taxing power of the government. States and cities also issue bonds to finance deficits. These bonds, however, are considered riskier because the tax base of the state or city could erode.
- The federal government—and only the federal government—can print more money. Like raising taxes, this has potential economic consequences (in the form of higher inflation) as well as political consequences. Nevertheless, the federal government does have that option, which is certainly not open to households and businesses.
These unique characteristics set the government apart from the other players in the economy. They also position the federal government to formulate and implement economic policy.
Fiscal Fundamentals
Fiscal policy is the general name for the federal government's taxation and expenditure decisions and activities, particularly as they affect the economy. (Monetary policy refers to policies that affect interest rates and the money supply.)
Figure 13.1 shows how C + I + G add up to determine the equilibrium level of GDP. (For convenience, we're assuming that net exports (Ex - Im) are zero.) Line “C” represents consumption by consumers. Line “C+I” represents consumption by consumers plus investment by businesses. Line “C+I+G” represents consumption plus investment plus government spending.
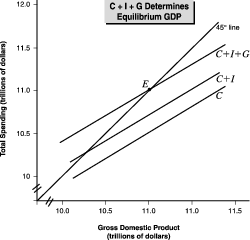
The 45 degree line shows all the points at which total spending equals gross domestic product. At any point on that line, the quantity demanded by the households, businesses, and government in the economy (total spending) equals the amount being produced (GDP). Whenever total demand equals total spending, the economy is in equilibrium.
Where is the actual equilibrium point for the economy? Where the total demand of households, businesses, and government—C + I + G—equals their production. That equilibrium point occurs where the line C + I + G intersects the 45 degree line. At that point, which is point “E” on the chart, total spending (total demand) and total production (GDP) are equal.
What About Taxes?
Figure 13.1 ignores taxes, but they are a crucial element in fiscal policy.
Taxes lower households' disposable income. The amount collected in taxes doesn't find its way into consumption (“C”). But if the government spends every dollar that it collects in taxes, then that amount does find its way into total demand through government expenditures. When that occurs, the GDP remains unaffected by taxes. The size of the economy is the same whether people choose to produce and consume private goods (angora sweaters) or public goods (army uniforms). The mix of goods doesn't affect the level of GDP, as long as the total amount spent on them doesn't change.
What happens when the government collects more in taxes than it spends?
Total spending—and therefore the equilibrium level of GDP—decreases. Suppose that the money for army uniforms is collected but not spent. In that case, there's no need to manufacture the uniforms, no need to staff the uniform factory, and no need to pay the workers, who now have less income to devote to consumption.
In general, when the government brings in more in taxes than it spends, it reduces disposable income and slows the growth of the economy. So, the fiscal policy prescription to stabilize an overheated economy is higher taxes.
In times of inflation—when too much demand is bidding up prices—a tax increase, coupled with no increase in government spending, will dampen the upward pressure on prices. The tax increase lowers demand by lowering disposable income. As long as that reduction in consumer demand is not offset by an increase in government demand, total demand decreases.
A decrease in taxes has the opposite effect on income, demand, and GDP. It will boost all three, which is why people cry out for a tax cut when the economy is sluggish. When the government decreases taxes, disposable income increases. That translates to higher demand (spending) and increased production (GDP). So, the fiscal policy prescription for a sluggish economy and high unemployment is lower taxes.
Spending policy is the mirror image of tax policy. If the government were to keep taxes the same, but decrease its spending, it would have the same effect as a tax increase, but through a slightly different channel. Instead of decreasing disposable income and decreasing consumption (“C”), a decrease in government spending decreases the “G” in C + I + G directly. The lower demand flows through to the larger economy, slows growth in income and employment, and dampens inflationary pressure.
Likewise, an increase in government spending will increase “G” and boost demand and production and reduce unemployment.
Those are the fundamentals of fiscal policy, and they are summed up in Figure 13.2.

To dampen economic growth and inflationary pressure, the government can increase taxes and keep spending constant, or decrease spending and keep taxes constant. To stimulate growth and reduce unemployment, the government can decrease taxes and keep spending constant, or increase spending and keep taxes constant.
Finally, the government can pursue its fiscal policy objectives more aggressively by simultaneously adjusting both taxes and spending. For instance, in a sluggish economy, the government could decrease taxes and increase spending at the same time. Each could be adjusted either by small amounts, so that neither taxes nor spending are changed too radically, or by large amounts to deliver a stronger dose of fiscal stimulus. Similarly, in an overheated economy, the government could increase taxes and decrease spending, if it wanted to dampen growth (and enrage voters).
Other Issues in Fiscal Policy
To keep things simple, the previous section omitted three other aspects of fiscal policy: the automatic stabilizing influence of fiscal policy, the multiplier effect, and the propensity to spend or save.
First, fiscal policy exerts an automatic stabilizing effect on the economy, even when the government makes no explicit changes in its tax or spending plans.
When the economy contracts, tax receipts automatically decrease (because incomes decrease). This effect is magnified by progressive taxation, our system applying higher tax rates to higher incomes. Workers who are laid off or lose their overtime pay automatically fall into a lower tax bracket. Their lower taxes bills will partially offset the effect of their lost income. Similarly, when incomes rise, particularly during inflation, bracket creep pushes people into higher tax brackets. The higher taxes they pay takes money out of their pockets—money they can no longer use to bid prices up even higher.
Government spending also acts as an automatic stabilizer, especially during downturns. The federal government tends to maintain its general level of spending during recessions, which ensures a solid baseline level of demand from the “G” in C + I + G. Also, programs of unemployment insurance and public assistance help to ease the burden of tough times on households.
Second, the multiplier will boost the effect of an increase or reduction in taxes or spending. For instance, an extra dollar of government spending will flow through the economy and, by being repeatedly respent, will magnify the stimulus provided by that incremental dollar. Likewise, a dollar of reduced spending will take a dollar out of the economy, and the multiplier applies to that as well.
Finally, like the multiplier, the propensities to spend and to save are at work. If the government reduces taxes to stimulate consumption, but households save the money rather than spend it, consumption will not rise, nor will investment. If people save the money, they are “sitting on their wallets” and consumption remains low. If consumption is low, businesses won't invest. This has been a problem in the application of fiscal stimulus in Japan, where people tend to save increases in income.
Excerpted from The Complete Idiot's Guide to Economics © 2003 by Tom Gorman. All rights reserved including the right of reproduction in whole or in part in any form. Used by arrangement with Alpha Books, a member of Penguin Group (USA) Inc.
To order this book direct from the publisher, visit the Penguin USA website or call 1-800-253-6476. You can also purchase this book at Amazon.com and Barnes & Noble.