Algebra: Climb Aboard the Coordinate Plane
Climb Aboard the Coordinate Plane
Thanks to a fun-loving mathematician named Ren© Descartes (a guy who contributed so much to math that I won't tease him for having a girl's name), we have the vastly useful mathematical tool called the coordinate plane. It is basically a big, flat grid used to visualize mathematical graphs. Check out Figure 5.1 for a look at the coordinate plane.
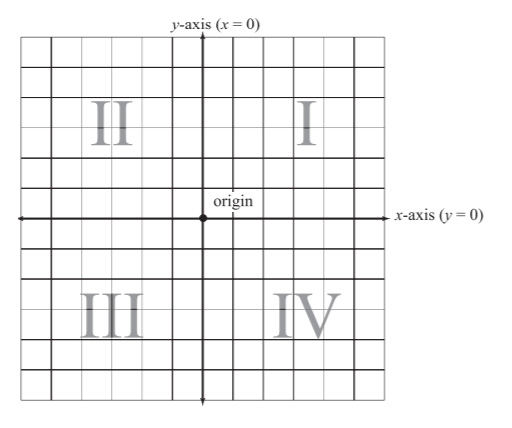
Figure 5.1The horizontal x-axis and the vertical y-axis intersect at the origin, and divide the plane into four quadrants (labeled with Roman numerals).
Talk the Talk
The coordinate plane is a flat grid used to visualize mathematical graphs. It is formed by the x-axis and y-axis, which are, respectively, horizontal and vertical lines that meet at a point called the origin. The axes split the plane into four quadrants.
To best understand the coordinate plane, pretend that it is the map of a small town. In this town, there are only two main roads, one that runs horizontally (called the x-axis) and one that runs vertically (called the y-axis). These two roads intersect once, right in the middle of town, at a location called the origin. This intersection splits the town into four quadrants, which are numbered in a very specific way. The northeast section of town is quadrant one (I), the northwest is quadrant two (II), the southwest is quadrant three (III), and the southeast is quadrant four (IV).
Just like normal roads, the x- and y-axes also have more official-sounding addresses, in addition to their names. The address of the x-axis is the equation y = 0. In fact, every one of the horizontal roads in this town has the address "y = something." The first horizontal road above the x-axis in Figure 5.1, for example, has equation (address) y = 1, the road above that has equation y = 2, and so on. The first horizontal road below the x-axis has equation y = -1, the next is y = -2, etc. Basically, all of the positive horizontal street addresses occur in quadrants I and II, and the negative ones are located in quadrants III and IV.
Critical Point
You can scale each grid line on the coordinate plane; each line could represent 1, 2, 5, 10, or any fixed number of units. However, unless otherwise noted, always assume that each grid line on the coordinate plane represents exactly 1 unit of measure.

Figure 5.2You're going to love the fresh-baked bagels in this quadrant II bakery.
In a similar way, the vertical streets (all of which have equations "x = something") are numbered as well. The y-axis has equation x = 0, and the streets to its right begin with x = 1, and get larger and larger. On the other hand, the street immediately to the left of the y-axis has equation x = -1, and the further left you go, the more and more negative the streets get. So, positive vertical streets run through quadrants I and IV, and the negative vertical streets run through quadrants II and III.
Because all of the streets have these handy addresses, it's very simple to pinpoint any location in town. For example, let's say I find a great bakery at the intersection of x = -3 and y = 4 streets as shown in Figure 5.2.
Written on the door of the bakery is its official coordinate plane address: (-3, 4). You see, every location in the coordinate plane has an address (x, y) called a coordinate pair, based on the intersecting street numbers. When writing the coordinate pair, make sure to list the x street first, and then the y street.
Talk the Talk
Every point on the coordinate plane is described by a coordinate pair (x,y). The x portion of the coordinate pair is sometimes called the abscissa, and the y portion is called the ordinate, but that terminology is very old, antiquated, and formal, so you may not hear it unless your teacher is old and antiquated.
I hope you weren't too insulted by the simplicity of my map metaphor for the coordinate plane, but I find it more interesting than the strict mathematical definition. Once you get good at plotting (graphing) points on the coordinate plane, you'll be ready to do more advanced things, like connecting those dots to form graphs.
Example 1: Plot these points on the coordinate plane: A = (2,0), B = (0,- 4), C = (-3,-2), D = (-72, 3), E = (5,-1), and F = (6,2).
Solution: Remember that each coordinate pair represents the intersection of a vertical street (the first number in the pair) and a horizontal street (the second number in the pair). For instance, point C lies at the intersection of the third vertical street to the left of the origin and the second horizontal street below it.
Points A and B will fall on the x- and y-axes, respectively, since they each contain a 0 in the coordinate pair. The trickiest point to plot is D, since it contains a fraction. To make things easier for you, convert the improper fraction -72 into the mixed number -312 (using the technique you learned). To plot D, count three and a half units to the left of the origin and then three units up. All of the answers to Example 1 appear in Figure 5.3.
Talk the Talk
Problem 1: Identify the points indicated on the coordinate plane of Figure 5.4.
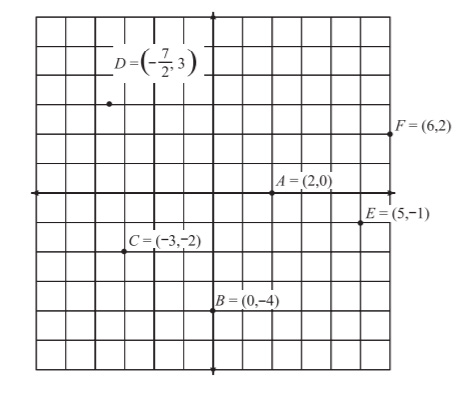
Figure 5.3The solution to Example 1.
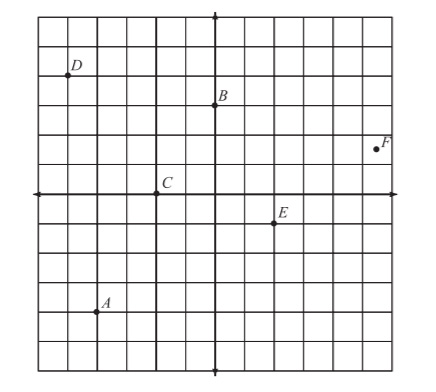
Figure 5.4List the (x,y) coordinates for each of the points A through F.
Excerpted from The Complete Idiot's Guide to Algebra © 2004 by W. Michael Kelley. All rights reserved including the right of reproduction in whole or in part in any form. Used by arrangement with Alpha Books, a member of Penguin Group (USA) Inc.
You can purchase this book at Amazon.com and Barnes & Noble.