Algebra: Solving One-Variable Quadratic Inequalities
Solving One-Variable Quadratic Inequalities
So far, this section has been chock-full of procedures that require precise step-by-step instructions, and the final topic of the section will be no different. In fact, there have been so many steps to follow in the last few topics, you probably feel like you're putting together Ikea furniture, but bear with me just a little longer and you'll know all you need to know about quadratics.
Remember back in Linear Inequalities when you learned that the solution to an inequality is often expressed as a graph, because there are almost always an infinite number of possible solutions? This is still true if the inequality contains a quadratic polynomial, like 2x2 + x - 2 < 0.
Let me jog your memory again. What do you use to graph an inequality containing only one variablea number line or a coordinate plane? If you answered coordinate plane, oooh, I'm sorry, you're wrong, but at least you'll walk away with some fine parting gifts and a home version of our game. The correct answer is a number line; the number of axes in the graphing system should match the number of unique letters in the equation or inequality. For example, since 2x2 + x - 2 < 0 contains only x (not x and y both), you should use a number line to graph it.
That's enough talk for now; let me explain the steps you'll follow to solve a quadratic inequality:
Talk the Talk
The critical numbers are the values of x for which an inequality equals 0 or is undefined. They break the number line into segments, called intervals.
- Pretend the inequality symbol is an equal sign and solve the corresponding quadratic equation. Those solutions are called the critical numbers of the inequality. You're not changing that inequality sign to an equal sign permanentlyonce you find the critical numbers, you can change it back.
- Graph the solutions on a number line. Just mark the critical numbers on the number line with either open or closed dots, depending upon whether or not the symbol allows for the possibility of equality (just like you did during the number line graphs of Linear Inequalities).
- Use test values to find the solution interval(s). The critical numbers will split the number line into segments, called intervals. Choose a test value from each interval and plug it into the original inequality for x. If the test value makes the inequality true, then so will all of the other values in that same interval, so it is part of the solution.
Even though the graph you create during this process tells you what the solution is, most teachers would rather you not just give the graph as an answer. They usually want you to express that interval as an inequality statement.
Example 5: Solve the inequality and graph the solution.
- 2x2 + x - 2 < 0
Solution: Pretend, for a moment, that this is actually the equation 2x2 + x - 2 = 0. Unfortunately, this quadratic cannot be factored, so you'll have to use either the quadratic formula or complete the square to get the solutions, which will be
Boy, those critical numbers sure are ugly. It's a good idea to type them into a calculator to figure out what decimal they're approximately equal to, so that you can plot them on the number line as I have done in Figure 13.2. (Since the inequality symbol, <, does not allow equality, you have to use open dots.)
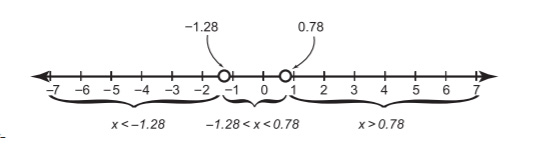
Figure 13.2The critical numbers break the number line into the three labeled intervals. Notice that when both endpoints of an interval are critical numbers, it's useful to write that interval as a compound inequality.
Now choose one value to represent each interval (I chose the simplest ones I could: x = -2, x = 0, and x = 1) and plug them into the original inequality, to see which values result in true statements.
| Test x = -2 | Test x = 0 | Test x = 1 |
|---|---|---|
| 2(-2)2 +- (-2)-2< 0 | 2(0)2 + (0) - 2<0 | 2(1)2 + (1)-2<0 |
| 2(4)-2-2 < 0 | 2(0)-2<0 | 2(1)+1-2 < 0 |
| 8-4<0 | 2-1<0 | |
| 4<0 False | -2<0 True | 1<0 False |
The interval containing x = 0 (the middle interval of Figure 13.2) is the only one that makes the inequality true, so it is the correct solution: -1.28 < x < .78. Of course, if you want to write the answer exactly right, you'd have to use the actual, ugly critical numbers, and not their decimal equivalents:
To make the graph of the solution, just draw the number line from Figure 13.2 and darken in the solution interval, so you end up with something like Figure 13.3.
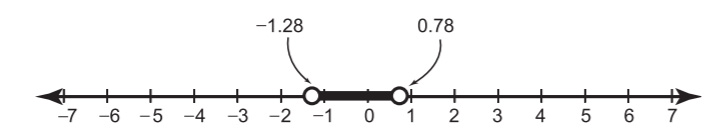
Figure 13.3The solution graph for the inequality 2x2 + x - 2 < 0.
You've Got Problems
Problem 5: Solve the inequality and graph the solution 2x2 + 5x - 3 ¥ 0.
Excerpted from The Complete Idiot's Guide to Algebra © 2004 by W. Michael Kelley. All rights reserved including the right of reproduction in whole or in part in any form. Used by arrangement with Alpha Books, a member of Penguin Group (USA) Inc.
You can purchase this book at Amazon.com and Barnes & Noble.