Look at These Prices!: Let's Stretch: Elasticity of Demand
Let's Stretch: Elasticity of Demand
Anyone who has set foot in a discount store knows that some sellers try to increase the quantity of goods they sell by lowering their prices. From what we saw about supply and demand, that should work. However, in reality, it may or it may not. Moreover, the seller may or may not bring in more money even if he does sell more goods at the lower price.
If a seller reduces his prices, will demand always increase? (Never say “always” in economics.) The more important question is, “How much should he reduce his prices?” In other words, how much will demand rise in response to a price reduction?
EconoTalk
Elasticity of demand refers to the change in demand for a good or service that occurs in response to a change in its price. Specifically, it is the degree to which an increase or decrease in price will change the quantity demanded. It is a way economists have of nailing down the relationship between price and demand more precisely.
Unitary elasticity occurs when the quantity of a product demanded changes in response to price changes in a way that leaves total revenue the same. Elasticity occurs when a reduction in price increases the quantity demanded so that the seller's revenue increases. Inelasticity occurs when a reduction in price increases the quantity demanded by more than zero but less than unity. (Unity refers to the proportional change in quantity sold and revenue that occurs under unitary elasticity.)
The answers to these questions depend on the buyer's situation and his need or desire for the product, as well as on the seller's situation. That is, the answers depend on the elasticity of demand for the product or service.
Don't be alarmed by the technical term “elasticity.” It's really a snap. (Sorry, I couldn't resist.) Elasticity of demand refers to the change in demand for a product or service that occurs when its price changes. Specifically, it is the degree to which an increase or decrease in price will change the quantity demanded.
First, I'll discuss the three degrees of elasticity—unitary elasticity, elasticity, and inelasticity. Then we'll look at the factors that contribute to the elasticity of demand of a product.
If you drive a car, you need gasoline. If the price of gasoline was cut in half starting next week, would you start buying twice as many gallons of it per week? If the price rose by 100 percent, would you buy half as much per week? Let's say that, in both cases, you would.
Let's put some numbers to this example. We'll start with gasoline at $1.50 per gallon and with you using 100 gallons a week. (Ever think of shortening your commute?) This example will show how changes in the price affect your demand and flow through to affect the revenue that the gas station receives from you. Revenue, also known as total sales, equals price multiplied by quantity, that is: R = P × Q.
Table 5.1 shows the changes in price, quantity, and revenue in the example I'm presenting here.
| P | × | Q | = | R | |
|---|---|---|---|---|---|
| Original situation | $1.50 | × | 100 gals. | = | $150 |
| Price drops 50% | $0.75 | × | 200 gals. | = | $150 |
| Price doubles | $3.00 | × | 50 gals. | = | $150 |
In this admittedly fanciful example, your demand for gasoline is characterized by unitary elasticity. Unitary elasticity occurs when the quantity of a product demanded changes in response to price changes in a way that leaves total revenue the same. Here, regardless of price increase or decrease, revenue remains at $150.
With unitary elasticity, the percentage increase in price calls forth an offsetting decrease in demand. If the seller doubles his price, he sells half as much. Similarly, a percentage decrease in price calls forth an offsetting increase in demand. If he halves his price, he sells twice as much. Either way, the seller brings in the same revenue. (His profit—the amount he makes after subtracting his costs from his revenue—may vary, but that's another story.)
The unitary elasticity relationship is depicted in Figure 5.1.
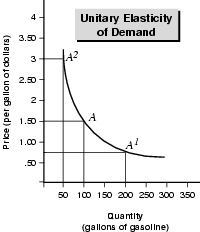
Figure 5.1 is saying that when the price decreases from $1.50 (point “A”) to $.075 (point “A1”), total revenue equals $150 in both cases (200 gallons at 75 a gallon equals $150).
This chart is also saying that the price increase from $1.50 to $3.00 leaves revenue unchanged, because the demand for gasoline falls to 50 gallons (50 gallons at $3.00 a gallon equals $150).
When a producer or seller faces unitary elasticity of demand, she can't increase revenue by increasing or decreasing her price. Why? Because the quantity demanded will exactly offset the effect of any change in price. However, that is rarely the case in the real world.
Selling More by Charging Less
Sticking with our gasoline example, suppose that in response to a 50 percent decrease in the price of gasoline you tripled your gasoline purchases to 300 gallons a week. What would be the effect on the service station's revenue? The second line in the -table below provides the answer: a sharp increase in revenue.
Similarly, let's suppose that if the price of gasoline doubled, you would use only one-third as much. This would generate revenue of $75, as shown in the third line of the table. (Incidentally, I am using numbers that illustrate the type of elasticity I am discussing. In reality, elasticity is “all over the place” both for any given individual and for groups that use a product. Also, elasticity can be greater in response to a price increase than to a price reduction, or vice versa.)
| P | × | Q | = | R | |
|---|---|---|---|---|---|
| Original situation | $1.50 | × | 100 gals. | = | $150 |
| Price drops 50% | $0.75 | × | 300 gals. | = | $225 |
| Price doubles | $3.00 | × | 25 gals. | = | $75 |
Here your demand for gasoline is characterized by elasticity of demand. In contrast to unitary elasticity, elastic demand occurs when a reduction in price increases the quantity demanded so that the seller's revenue increases. This is the way things “should” work for most businesses: The seller can sell more by cutting his price—and it's worth it to the seller.
As the table also shows, however, this cuts both ways: The seller will lose revenue if he increases his price. With elastic demand, an increase in the price calls forth a decrease in the quantity demanded which decreases the seller's revenue.

Figure 5.2 demonstrates that a decrease in price increases demand by more than unity. At the $0.75 price, demand increases to 300 gallons, bringing revenue up to $225 (which is equal to $0.75 × 300). With elasticity—as opposed to unitary elasticity or inelasticity—decreasing the price increases revenue. Also, the area of the rectangle formed by connecting the $0.75 price point with point “A1” and point “A1” with the 300 gallon mark is clearly larger than the area of the rectangle formed by connecting the $1.50 price point with point “A” and the 100 gallon mark. That, too, represents the higher revenue resulting from the price decrease.
EconoTip
A change in price may result in only a small increase in demand and revenue. The examples I'm choosing here use round numbers and simple relationships for the sake of clarity. But many producers face markets in which a price decrease of 10 percent may increase revenue by only 2 percent. This may or may not be a profitable decision for the producer. It depends on his costs. However, when a price reduction increases both the quantity demanded and revenue, it is, by definition, a case of elasticity of demand.
The elasticity of demand chart also demonstrates that, with elasticity, a price increase will decrease demand to the point where revenue also decreases. At the $3.00 price, demand falls to just 25 gallons and revenue drops to $75.
Are there situations in which a price change will cause the quantity demanded to drop to zero? Yes. Economists call this infinite elasticity. Cases of infinite elasticity are rare and usually confined to a single locale or a special situation.
For instance, the Internet has created an environment in which many users feel that everything on the web should be “free.” Now it's not really free, because they've paid their Internet service provider for access to the web. But they feel they should not have to pay one penny more for information, music, or pictures pulled from websites. For some web users, this is a matter of principle, and they will not pay at all for something they believe should be free. Therefore, if a fee is requested as they are browsing a site, their demand for that site's offerings is zero. In such a situation, a price cut (let alone a price increase) is impossible because the price the buyer will pay is zero.
Figure 5.3 portrays infinite elasticity.

Figure 5.3 depicts the situation for our highly principled Internet browser. He will pay $10 a month to his Internet service provider for access to the web. But he will not pay a penny more for any web-based content. Regardless of the price, if there is a price beyond the $10 access charge, his demand for web-based content is zero. It is also saying that there is no real relationship between price and quantity demanded.
Inelastic Demand: No Price Cuts Here
Some sellers learn, to their dismay, that a price decrease does not increase revenue. For instance, say our service station reduces his price by 50 percent, but you increase your gasoline usage by only 20 percent.
| P | × | Q | = | R | |
|---|---|---|---|---|---|
| Original situation | $1.50 | × | 100 gals. | = | $150 |
| Price drops 50% | $0.75 | × | 120 gals. | = | $90 |
| Price doubles | $300 | × | 80 gals. | = | $240 |
The result here is lower revenue, and an instance of inelastic demand. In general, inelastic demand occurs when a price decrease calls forth an increase in quantity that results in a decrease in revenue. In other words, price goes down, quantity goes up, but revenue still goes down.
This means that the effect on quantity demanded is less than unity but greater than zero.

This chart depicts inelasticity of demand, meaning a decrease in price increases demand but not by enough to raise revenue. Inelasticity basically means that people demand a certain quantity of the product and are not going to change that demand very much because of price decreases. They'll change it a bit, but not by much.
However, this also cuts both ways. Inelasticity also means that demand will not decrease very much in the face of a price increase. Therefore, a seller of a product with inelastic demand can raise prices and people will generally pay the increase. They can't really reduce their consumption all that much. As the chart shows, a doubling of the price calls forth a mere 20 percent decrease in demand. This boosts the gas station's revenue to $240, well above the $150 brought in before the price decrease.
However, although consumers cannot reduce their consumption much in the short run, as we'll see later in this section, they can reduce their demand for almost any product in the long run.

Zero elasticity, or what economists call perfect inelasticity, occurs when a price change has no effect on the quantity demanded. Certain medicines and health care services face perfectly inelastic demand (or close to it). For instance, people with AIDS require certain medicines and people with kidney disease require access to a dialysis machine regardless of the cost. Figure 5.4 depicts inelastic demand, while Figure 5.5 depicts zero elasticity, also called perfect inelasticity (the quantity remains the same, regardless of price).
Perfect, or zero, elasticity means that no matter how the price changes, the quantity demanded remains the same. The consumer needs this amount of the product, regardless of how expensive or inexpensive it is.
Excerpted from The Complete Idiot's Guide to Economics © 2003 by Tom Gorman. All rights reserved including the right of reproduction in whole or in part in any form. Used by arrangement with Alpha Books, a member of Penguin Group (USA) Inc.
To order this book direct from the publisher, visit the Penguin USA website or call 1-800-253-6476. You can also purchase this book at Amazon.com and Barnes & Noble.