Supply, Demand, and the Invisible Hand: Equilibrium: Mr. Demand, Meet Mr. Supply
Equilibrium: Mr. Demand, Meet Mr. Supply
The beauty of the market is that the competing motivations of consumers and producers interact to arrive at a price and quantity for a product that's determined by impersonal market forces. You've heard the expression “market price” (or seen it written on menus next to the word “lobster”). The market price for a product is the price at which the quantity demanded is equal to the quantity supplied. Figure 4.5 shows how this occurs.
The arrows along the supply and demand curves in this chart indicate the pressures at work in the market for beef (or any market for that matter). To understand how the price and quantity reach the equilibrium point, let's first examine the area above that point. Above the equilibrium point—say, at the $4 price where I have drawn a line—producers would be supplying more beef (90,000 pounds) than consumers would be demanding (40,000 pounds). That price results in a surplus of beef on the market—supply would be greater than demand because consumers won't buy enough of it at the $4 price.
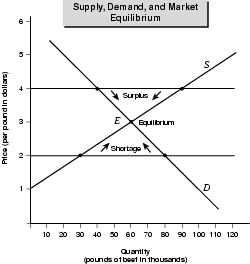
If supply is greater than demand, then there are meat lockers full of unsold beef across a region. What are the suppliers of that beef going to do? They will cut the price until consumers start buying it. In this way, a surplus of a product puts downward pressure on its price.
It also puts downward pressure on supply. If beef is not selling briskly—if there's a surplus of it on the market—what are producers going to do? They are going to raise fewer cattle. They'll shift the resources to raising sheep or maybe hogs. Maybe some ranchers will get out of the business. Whatever it takes, that surplus quantity of beef will be taken off the market for the simple reason that consumers don't want to buy that quantity of beef at the price suppliers want for it. The excess supply will dwindle until the quantity supplied equals the quantity demanded—at a price both consumers and producers can live with, in this case $3 a pound.
So surplus quantity puts downward pressure on the prices and the supply of the product. That pressure is exerted by market forces until the quantity supplied equals the quantity demanded.
Let's turn to the area below the equilibrium point. There we have a shortage of beef. The market is demanding more beef (80,000 pounds) than the quantity that producers are supplying (30,000 pounds). That results in a shortage, which puts upward pressure on prices.
How? When sellers see that they are constantly running out of beef before the next delivery, they know they can raise the price of the stuff. Consumers, in effect, are bidding up the price. When the price starts increasing (from the $2 mark), producers start producing more beef. They send their cattle to market sooner, and they move resources away from raising sheep and into raising cattle. If it's a long-term trend, more people may take up cattle ranching.
Again, whatever it takes, that shortage of beef will disappear as the price rises and the higher prices bring more beef to market. How much more beef will come to market? Enough to bring the quantity supplied equal to the quantity demanded—in this case, 60,000 pounds—again, at a price both consumers and producers can live with.
Market Forces Are the Invisible Hand
The market forces described here, working through the price mechanism, are the essence of Adam Smith's “invisible hand” (see Overview of Economics). The beauty of a market is that supply and demand come into balance without central planning, mandates, boycotts, raids, or wars, as each consumer and producer responds to the price of the product. The price sums up, contains, and channels the forces of the market—the motives and desires of consumers and producers.
This is not to say that markets do away with pain and loss for consumers and producers. Market forces generate tremendous amounts of pain and loss. People go without beef, suffer protein deficiencies, and even go hungry. They see people eating sirloin steak and prime rib and feel terrible that they can't afford it. Producers get stuck with beef they can't sell. Some meat may be sold at a loss or go to waste. Some ranchers and meat wholesalers go out of business and lose their livelihoods.
Markets can be inefficient and even cruel. However, the pain and loss that occur in the market arise largely from decisions—good and bad decisions—made freely by consumers and producers. Therefore, most Americans prefer the inefficiencies and cruelties of the market to those of a command economy.
What About Shifts in Demand or Supply?

Finally, let's return to those overall shifts in demand or supply. What effect do they have?
Essentially, they shift the equilibrium point up or down. Two pictures will be worth 2,000 words. First, let's look at the effect of a shift in demand as illustrated in Figure 4.6.
As the chart shows, an increase in demand raises the quantity demanded at a given price. This results in a new, higher market price, and producers will be more than happy to supply that higher quantity, which is 75,000 pounds, at that higher market price, which is $3.50. Thus, when demand shifts upward, the equilibrium point rises.

To see the effect of a decrease in demand, simply reverse the situation and pretend that the curves in the chart are reversed (that D is the new curve and D1 is the original one). A shift to lower demand decreases the quantity demanded at a given price. Producers will (not quite so happily) meet that lower demand at a new, lower market price. This generates a new, lower equilibrium point.
Turning to a shift in supply, as depicted in Figure 4.7, an increase in supply—which shifts the curve to the right—lowers the market price to $2.50 and raises quantity supplied from 60,000 to 70,000. That is why overcapacity or numerous competitors in an industry will cause the price to decrease. There's more supply than people demand.
However, a decrease in supply—which shifts the curve to the left—has the opposite effect, as you can see by pretending that S1 is the original curve and S is the new one. The decrease in supply increases the market price. That's because demand now exceeds the quantity supplied, and in that circumstance consumers bid up the price.
Excerpted from The Complete Idiot's Guide to Economics © 2003 by Tom Gorman. All rights reserved including the right of reproduction in whole or in part in any form. Used by arrangement with Alpha Books, a member of Penguin Group (USA) Inc.
To order this book direct from the publisher, visit the Penguin USA website or call 1-800-253-6476. You can also purchase this book at Amazon.com and Barnes & Noble.