Algebra: Graphing with Slope-Intercept Form
Graphing with Slope-Intercept Form
You already know a couple of ways to graph a linear equation, but I thought I'd toss one more method into the mix. I know you don't need a hundred different ways to graph lines any more than you need a hundred different ways to tie your shoes, but since graphing using the slope-intercept form of a line is my favorite technique, I really want to share it with you. It'll be a bonding moment for us. Besides, there's nothing more boring than plotting point after point to come up with a graph. This way is a little different, and it helps you understand how the slope works, in case you are a little fuzzy on that.
How'd You Do That?
In case you're wondering where the slope-intercept form comes from, and how we can be so sure that the x-coefficient is the slope and b is the y-intercept, I'll clue you in on its origins.
Let's say there's a line with slope m and y-intercept (0,b) (the familiar variables from slope-intercept form). Apply point-slope form to get the equation of that line.
y - y1 = m(x - x1)
y - b = m(x - 0)
y - b = mx
Just solve for y and you end up with the slope-intercept form.
y = mx + b
A star is born!
Here are the steps to follow in order to graph a line using slope-intercept form:

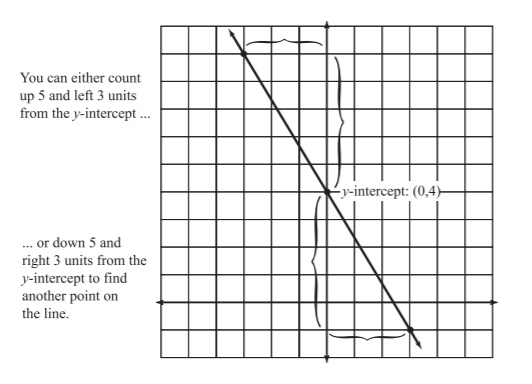
Figure 6.1Either road you choose, you still end up on the same line.
You've Got Problems
Problem 3: Graph the equation -2x - y = 1 using the slope-intercept form.
- Solve the equation for y. The equation needs to be in slope-intercept form.
- Determine the slope and y-intercept of the line. Remember, this is as easy as looking at the numbers on the right side of the slope-intercept equation.
- If the slope is negative, rewrite it with the negative sign in the numerator or denominator. You can stick that negative sign either place (but not both at the same time), it doesn't matter which.
- Plot the y-intercept of the graph. Remember, the y-intercept has coordinates (0,b); mark that point on the graph.
- Start at the y-intercept and use the slope to count steps to another point on the graph. You learned how to do this in Graphing Linear Equations. Remember, positive numbers in the numerator mean up, negative numbers in the numerator mean down, positives in the denominator mean right, and negatives in the denominator mean left. For example, a slope of -23 means to count down 2 units and right 3 units from the y-intercept to get another point on the graph.
- Connect the two points. Just connect the dots to finish the graph. Remember, it extends infinitely long in both directions.
Example 3: Graph the equation 5x + 3y = 12 using the slope-intercept form.
Solution: Start by solving the equation for y.
- 3y = -5x + 12
- y = -53x + 4
The y-intercept is (0,4); its slope should be rewritten with the negative sign in either the numerator or denominator: -53 or 5-3.
Plot the y-intercept and count your way to the next point based on the slope you chose. You should either count down five and right three units (-53) or count up five and left three units (5-3). Either way, when you connect the dots, you'll end up with the same line, as shown in Figure 6.1.
I sort of like this method of graphing lines because it feels like I'm reading a treasure map: Start at the big palm tree, and then take five paces due south and three paces due east to reach the Golden Booty (which, by the way, sounds like a great name for an R&B star).

Excerpted from The Complete Idiot's Guide to Algebra © 2004 by W. Michael Kelley. All rights reserved including the right of reproduction in whole or in part in any form. Used by arrangement with Alpha Books, a member of Penguin Group (USA) Inc.
You can purchase this book at Amazon.com and Barnes & Noble.
