Time Spent in the 90s

More sleep, fewer chores?
by Beth Rowen |
Most adult Americans would likely agree that the 1990s were boom times. But there's a price for prosperity, and it's easy to assume that the price would be sleep deprivation and less family time. Not so, according to a recent eight-year study.
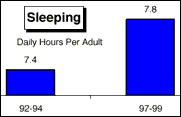
According to the NPD Group's study, Time Lines: How Americans Spent Their Time During the '90s, both men and women actually slept more in the late 1990s than they did in the early '90s. The average adult slept 7.8 hours a night in the latter part of the '90s, up from 7.4 hours a night earlier in the decade. Instead of sacrificing shut-eye, Americans cut back on household chores, food preparation, grocery shopping, and believe it or not, working.
 The study showed that the average workday decreased by six minutes from 1992 to 1999. Further scrutiny reveals that men's schedules account for the drop, as women's workdays have increased.
Many working parents would probably find this hard to believe, but the study showed that adults spent more time per day with their kids and pets later in the decade than they did early on. In the 1992-1994 survey, parents spent an average of 108 minutes per day caring for their kids or pets, while the number jumped to 120 in the 1997-1999 study.
 Mothers, predictably, remained primary caregivers. While none of these changes are monumental societal shifts, they do refute the widely accepted claim that Americans are spending more time at work and less with family.
The NPD Group, a marketing research firm, began the study in 1992 to help marketers determine how Americans spend their time. Each year more than 4,000 adults were asked to complete a comprehensive, one-day time diary, indicating which activitybest described what they were doing every 30 minutes. The company then analyzed the data of 3,000 of the most demographically representative respondents.
| Related Links | |
| Median Family Income Participation in Leisure Activities, 2001 Personal Consumption Expenditures for Recreation: 1990 to 2001 Percent of Adult Population Doing Volunteer Work, 2000 |
