Ten Years After Hurricane Katrina: Fact Sheet

From the U.S. Census Bureau
Hurricane Katrina is the costliest U.S. hurricane on record, and the deadliest to strike our nation since 1928. After initially making U.S. landfall on Aug. 25, 2005, in South Florida as a Category 1, it moved into the Gulf of Mexico, rapidly intensified into a Category 5 and made its second landfall early the morning of Aug. 29 in Plaquemines Parish in Southeast Louisiana as a strong Category 3 with sustained winds of 125 mph. After briefly moving over water, it made a third landfall later that morning near the Louisiana-Mississippi border. Katrina weakened as it moved north-northeastward over land but remained a hurricane as far inland as the vicinity of Meridian, Miss., a straight distance of more than 130 miles from the coast. Ultimately, Katrina was responsible for 1,833 deaths and damage estimated at $151 billion, including $75 billion in the New Orleans area and along the Mississippi coast. Federal disaster declarations issued in the hurricane?s wake covered not only all of the coastal counties of Louisiana, Mississippi and Alabama, but extended well inland to include cities such as Baton Rouge, La.; Jackson, Miss.; and Tuscaloosa, Ala.
This Fact Sheet focuses on the two areas that received significant damage: the New Orleans metro area and coastal portions of Mississippi. It compares statistics from before the hurricane struck to a year later, and currently, using a variety of demographic and economic measures.
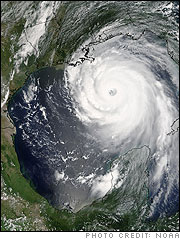 The eye of the storm bears down on the Gulf Coast Hurricane Links
Other Great Weather Disasters
Additional Resources |
Louisiana
Note: The New Orleans-Metairie, La., Metropolitan Statistical Area currently consists of Jefferson, Orleans, Plaquemines, St. Bernard, St. Charles, St. James, St. John the Baptist and St. Tammany parishes. St. James Parish was not part of the metro area in 2005 and 2006, but is included for those years in the data below for comparability.
Population
1.252 million
Population of the New Orleans metro area as of July 1, 2014.
2005 population | 2006 population | 2014 population |
1.386 million | 1.040 million | 1.252 million |
50
For the first time since Hurricane Katrina struck, New Orleans returned in 2014 to the list of the nation?s 50 most populous cities, ranking 50th at 384,320. The city?s population was 494,294 on July 1, 2005, before dropping to 230,172 one year later.
67.3%
Percentage of the city of New Orleans? population that was single-race black as of July 1, 2005. The black population was the largest race or ethnic group in the city before Katrina hit, and at 58.8 percent remained the largest race or ethnic group in the city immediately after Katrina hit in 2006. In 2014, the black population remains the city?s largest race or ethnic group at 59.8 percent.
City of New Orleans
| 2005 | 2006 | 2014 |
Black | 67.3% | 58.8% | 59.8% |
White, non-Hispanic | 26.5% | 33.1% | 31.2% |
Hispanic | 3.5% | 4.8% | 5.5% |
Asian | 2.4% | 3.0% | 3.0% |
American Indian Alaska Native | 0.3% | 0.4% | 0.4% |
Native Hawaiian/Other Pacific Islander | 0.03% | 0.1% | 0.1% |
Housing
553,627
Number of housing units in the New Orleans metro area as of July 1, 2014.
| 2005 housing units | 2006 housing units | 2014 housing units |
592,800 | 438,278 | 553,627 |
Business Establishments and Employment
29,794
Number of business establishments with employees in the New Orleans metro area in 2013. These businesses employed 475,098 people.
| 2005 | 2006 | 2013 |
Business establishments | 31,401 | 29,002 | 29,794 |
Employment | 517,194 | 427,373 | 475,098 |
The Economy (New Orleans metro area)
Selection of establishments
Retail Trade
| 2005 | 2006 | 2013 |
Grocery stores | 573 | 430 | 461 |
Gasoline stations | 447 | 407 | 481 |
Pharmacies and drug stores | 221 | 165 | 194 |
Accommodations and Food Services
| 2005 | 2006 | 2013 |
Hotels (except casino hotels) | 259 | 227 | 269 |
Restaurants and eating places | 2,138 | 1,860 | 2,375 |
Construction
| 2005 | 2006 | 2013 |
Residential building construction establishments | 535 | 652 | 396 |
Nonresidential building construction establishments | 189 | 220 | 220 |
Highway, street and bridge construction establishments | 28 | 26 | 41 |
Source for statements in this section: County Business Patterns
Mississippi
Note: The Mississippi coastline counties consist of the three that lie on the Gulf of Mexico: Hancock, Harrison and Jackson.
Population
386,144
Population of the Mississippi coastline counties as of July 1, 2014.
2005 population | 2006 population | 2014 population |
383,412 | 347,253 | 386,144 |
Race and Hispanic Origin
| 2005 | 2006 | 2014 |
White, non-Hispanic | 73.1% | 72.6% | 68.8% |
Black | 19.7% | 19.9% | 21.4% |
Hispanic | 3.4% | 3.6% | 5.2% |
Asian | 2.2% | 2.3% | 2.5% |
American Indian Alaska Native | 0.5% | 0.5% | 0.5% |
Native Hawaiian/Other Pacific Islander | 0.1% | 0.1% | 0.1% |
Housing
174,468
Number of housing units in the Mississippi coastline counties as of July 1, 2014.
| 2005 housing units | 2006 housing units | 2014 housing units |
169,949 | 146,434 | 174,468 |
Business Establishments and Employment
7,041
Number of business establishments with employees in the Mississippi coastline counties in 2013. These businesses employed 125,157 people.
| 2005 | 2006 | 2014 |
Business establishments | 7,515 | 7,149 | 7,041 |
Employment | 125,933 | 109,886 | 125,157 |
The Economy (Mississippi coastline counties)
Retail Trade
| 2005 | 2006 | 2013 |
Grocery stores | 71 | 62 | 63 |
Gasoline stations | 194 | 164 | 190 |
Accommodations and Food Services
| 2005 | 2006 | 2013 |
Hotels (except casino hotels) | 105 | 72 | 84 |
Restaurants and eating places | 547 | 471 | 590 |
Construction
| 2005 | 2006 | 2013 |
Residential building construction establishments | 156 | 201 | 71 |
Nonresidential building construction establishments | 38 | 48 | 57 |
Highway, street and bridge construction establishments | 16 | 21 | 16 |
Gulf Coast Towns: Bay Saint Louis, Pass Christian and Waveland, Miss.
These towns provide an example of how ZIP Code Business Patterns data can be used to provide statistics for local areas.
Population
| 2005 | 2006 | 2014 |
Bay Saint Louis, Miss. | 11,388 | 9,280 | 11,287 |
Pass Christian, Miss. | 5,845 | 4,969 | 5,308 |
Waveland, Miss. | 7,849 | 6,436 | 6,419 |
Number of Businesses
| 2005 | 2006 | 2013 |
Bay Saint Louis, Miss. (ZIP code 39520) | 353 | 283 | 265 |
Pass Christian, Miss. (ZIP code 39571) | 215 | 187 | 189 |
Waveland, Miss. | 136 | 114 | 120 |
Additional Resources
Hurricane Katrina resource maps:
http://www.census.gov/geo/maps-data/maps/katrina_resource_maps.html
Migration flows:
http://flowsmapper.geo.census.gov/flowsmapper/flowsmapper.html
OnTheMap for Emergency Management provides reports on the workforce and population for current natural hazard and emergency related events.
http://onthemap.ces.census.gov/em.html