Weather: Bring on the Machines
Bring on the Machines
Computers make forecasting easier, although not necessarily more accurate. One can simply rip and read a computer product and be correct in a 24- to 36-hour forecast about 85 percent of the time. Yet I never feel sure until I take a good look around and examine the basic charts such as the surface, 850 mb, and 500 mb, but computers really do make forecasting almost a breeze.
Weather-Speak
Rip-and-read meteorologists are people who just rip and read the computer outputs and then deliver the forecast as written by the machines.
The following table shows an array of data for Bridgeport (BDR). It's called "NGM MOS GUIDANCE." The "NGM" portion stands for the nested grid model. It's one of the earlier computer models used to project the weather. In the next section we'll get into the many new and improved computer models, but we can easily interpret this data now. This particular model has worked best for temperature projections.
This computer product shows the high and low temperatures expected for the next two days. The row labeled "MX/MN" gives those readings. From October 19 to October 20, the maximum is 71 degrees. The overnight low is 47. The next day's high temperature is 64 degrees, and the low is 42. So there we go—the temperature forecast for the next 48 hours. Other rows of data include clouds (CLDS), wind direction (WDIR), wind speed (WSPD), and probability of precipitation in 6- and 12-hour periods (POP06, POP12). If the data is missing or not available, the numbers (999 …) are printed. This model includes the straight output from the computer along with some climatological adjustment for specific locations. Those adjustments are automated, too.
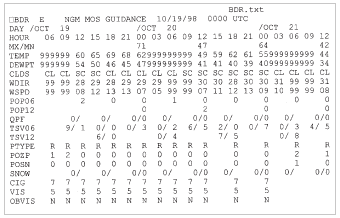
The computer guidance for Bridgeport, October 19, 1998.
The amount of information is huge. The row indicating clouds lists the cloud cover as clear (clr), scattered (sct), broken (bkn), or overcast (ovc). In this case, the conditions are clear or just with scattered clouds. The machine is looking for a sunny day and a pretty quiet spell through 48 hours. The probability of precipitation doesn't even reach 5 percent—but it did rain early in the day and overnight, which the computer completely missed. The machine isn't perfect, but the trend toward dry weather is supported by all the other charts we've looked at. So at least from the morning on, the computer seems reasonable.
Weather-Wise
A forecast chart for a specific time is called a prognostic chart, or a prog. This is generally a "machine-made" forecast.
The row indicating wind direction shows the flow to be from the west or northwest. We add a zero to that number, and the direction of the wind is given in degrees of a compass. The wind in this case is from around 280 or 290 degrees. The speed isn't outrageous. Again that "999" represents missing data, but what is available shows speeds up to 12 or l3 knots, which isn't especially fast. A similar output is shown below for Hartford on that day. The Hartford station is located at Bradley Airport (BDL).

The computer guidance for Hartford, October 19, 1998.
Without much further ado, we can predict that the temperature will reach the 70s, skies will be sunny, and winds will be out of the northwest from 10 to 15 mph. Overnight, skies will be clear, the temperature will dip into the upper 40s, and another sunny day will follow for Tuesday, but cooler with temperatures in the mid-60s.
So far, nothing that the computer has presented is out of balance with our expectations from the basic data and from looking outside. That provides plenty of confidence.
Excerpted from The Complete Idiot's Guide to Weather © 2002 by Mel Goldstein, Ph.D.. All rights reserved including the right of reproduction in whole or in part in any form. Used by arrangement with Alpha Books, a member of Penguin Group (USA) Inc.