Weather: Now for the Real Work
Now for the Real Work
So far, most of what I knew about the weather on that day in October consisted of my own observations. Now it was time to look at other observations taken at locations over a wide area and see how this data was mapped out.
Checking Out the Data
I arrived at the weather center at 3:30 A.M. My first task was to examine the flow of information and make sure I had a handle on what was really happening. Our television station has a network of automated weather stations installed at schools throughout our area. The instrumentation is quite sophisticated, even if it's not the caliber of the National Weather Service ASOS network. I immediately polled those stations by punching in a computer command. Within the hour, a vast amount of data would be available. I had a detailed picture of temperature, dew point, wind, pressure, relative humidity, and precipitation. That data is combined with the coded information from the National Weather Service, and I learned that very little rain fell with the front. No station reported more than .01 inch of rain—the threshold of "measurable" precipitation.
The temperatures were mild for that time of year. Readings were close to 60 degrees, almost the normal high of 63 degrees. In mid-October, early-morning temperatures should be 20 degrees lower. The clouds and the south wind kept temperatures up during the night. By 4:30 A.M., all stations were showing a major change. The wind had shifted into the west, although the temperature remained relatively mild.
Weather-Wise
Our observations provide the keenest insights about the weather. Even with all the great tools of technology, I look outside before going on the air.
In addition to the data from the various weather stations, I looked at Doppler radar and saw that the early rain had completely raced across Connecticut at 40 mph. By the time I got into the weather office, the last of the rain was located in the extreme eastern portions of the state. Then I checked the satellite imagery and saw that the clouds, too, had raced eastward at express speeds. Skies became mostly clear at the New York-Connecticut border, and nothing especially solid or ominous was present farther west. It sure looked like the weather was clearing. It would seem that a cold front had moved through because winds moved into the west, but where was the colder air? Actually cold fronts don't always bring about a sharp change in temperature. Sometimes the air can even be warmer, as is the case during the summer. In the case of this cold front, it seemed that the cooler turn was going to be a gradual one.
Weather-Wise
On a weather map, triangles represent a cold front while semicircles represent a warm front. They point in the direction toward which an air mass is moving. When you see alternating triangles and semicircles, this represents a stationary front.
Looking at the Surface Maps
The National Weather Service prepares an entire array of charts and maps that help analyze and forecast the weather. One map I studied closely early that Monday morning was a surface chart, as shown in the following figure. It consists of lots of numbers, lines, and more lines.
Each major National Weather Service station is represented and the data is recorded according to a special station model. The temperature is in the upper left of the station model. The number in the lower left represents dew point. Also a short line extends out from the station position representing the direction the wind is coming from. A line extended into the northwest means the wind is coming from the northwest. Barbs, or flags, are attached perpendicularly to those lines to represent wind speed. A longer line represents 10 knots, or 10 nautical miles per hour. A shorter line represents five knots.
In the upper right, barometric pressure is listed in code. The pressure is given in millibars, or hectopascals. For example, a number of "207" means that the pressure is 1020.7 millibars. A coded number of "980" indicates that the pressure is 998.0 millibars. The pressure is always around 1,000 millibars. The station location is shown as a circle filled in according to the degree of cloudiness. A circle that's completely filled indicates mostly cloudy skies. An open one indicates mostly clear conditions. If any precipitation is occurring, that's indicated between the temperature and dew point with a special code.
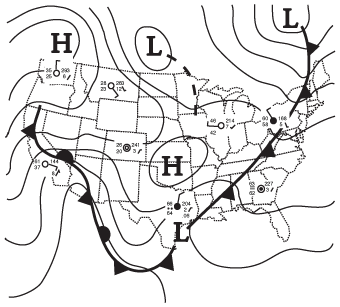
Surface weather map for October 19, 1998.
Fronts are shown according to a standard format. Lines drawn with triangles are cold fronts. Those lines with semi-circles are warm fronts. The triangles and semi-circles point in the direction that a front is moving. Alternating triangles and semi-circles would indicate a stationary front and, when semi-circles and triangles are on the same side of the front, that front's occluded. Then there are lines that look like contours. These are isobars, lines of constant pressure. Those lines enclose areas of high pressure (H) and areas of low pressure (L). Usually these lines are drawn at intervals of four millibars. Notice how the areas of high pressure tend to have clear skies, while the areas of low pressure have overcast conditions. No surprises here.
Now the surface map for this Monday morning showed a cold front extending from eastern New York to eastern Texas. The time of the map was listed as "06z" in the lower left-hand portion of the chart. That means the map was prepared from data collected at 0600 Greenwich Mean Time, or 2 A.M. Eastern Daylight Time, which is four hours earlier. Based on all the other data that I looked at from local stations, I could safely assume that the front that had been in eastern New York at 2 A.M. had moved east of Connecticut by 5 A.M. By the way, the heavy rain that occurred in Texas was associated with the southern portion of the front. Evidently as the drier, cooler air ran into the pure tropical air of the Gulf states, the weather became explosive. So the surface weather map confirmed that a cold front was moving to the east. It also showed a huge high-pressure region extending from the Pacific Northwest to the Midwest. Something so extensive could result in an extended spell of sunny weather, even if temperatures did change.
Excerpted from The Complete Idiot's Guide to Weather © 2002 by Mel Goldstein, Ph.D.. All rights reserved including the right of reproduction in whole or in part in any form. Used by arrangement with Alpha Books, a member of Penguin Group (USA) Inc.