Algebra: Kinky Absolute Value Graphs
Kinky Absolute Value Graphs
One final word about graphing linear equations before I wrap this section up. Remember in Solving Basic Equations when you learned that equations containing an x in absolute values required a slightly different solution method than regular, nonabsolute value equations? You had to break the equation into two parts to get the answer. Well, you have to graph them a little differently than regular linear equations, too. Whereas the graph of a normal linear equation looks like a line, an absolute value linear equation graph looks like a "V." It's basically a line with a kink in it, a sharp point (or vertex) where the graph changes directions.
In Figure 5.8, I've drawn the graphs of y = x - 3 and y = |x - 3|. Both of the graphs have the same coordinates for their x values greater than 3.
However, when x is less than 3, the left graph dips below the x-axis (meaning that its y values are negative). See how the right graph makes a sharp turn in order to avoid going below the x-axis altogether? This is because the equation shown in the right graph sets y equal to an absolute value! Remember, absolute values can never be negative, and the graph reflects this by avoiding negative y values like the plague.
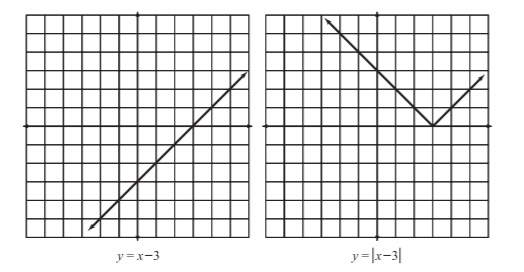
Figure 5.8The graph of y = |x - 3| takes drastic measures to avoid negative values, unlike y = x - 3.
The best way to graph a linear absolute value is to find exactly where its vertex is, plot it, and then plot one point to the right and one point to the left of it, so you can draw the branches of the graph.
Kelley's Cautions
If you draw an absolute value graph, and it dips below the x-axis, that doesn't necessarily mean you did it wrong! Some linear absolute value equations will still have negative y's. For example, if you plug x = 2 into the equation y = |x| - 5, you'll get y = -3.
Example 5: Graph the equation y = -12|x + 4| - 3.
Solution: To find the vertex of the graph, set just the contents of the absolute values equal to 0 and solve for x.
- x + 4 = 0
- x = -4
Now find the corresponding value for y when x = - 4 to get the coordinate pair for the vertex. (Plug x = - 4 back into the original equation.)
- y = 12|(-4) + 4| - 3
- y = - 12(0) - 3
- y = -3
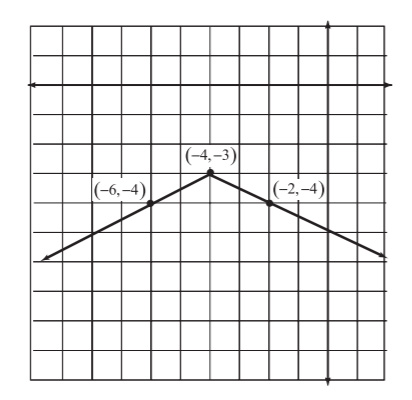
Figure 5.9The graph of y = -12|x + 4| - 3, the solution to Example 5. Note that this coordinate plane is shifted to highlight quadrant III.
You've Got Problems
Problem 5: Graph the equation y = |2x - 4| + 1.
The vertex of the graph occurs at (- 4,-3), so plot that point on the coordinate plane. Now choose one x value to the left of the vertex and one to the right (in other words, choose one x which is smaller than -4 and one which is larger), and plug them both into the original equation. I chose x = - 6 and x = -2.
- y = -12|(-6) + 4| -3 y = 12|(-2) + 4| - 3
- y = 12|-2| - 3 y = 12|2| - 3
- y = 12(2) - 3 y = -12(2) - 3
- y = -1 - 3 y = -1 - 3
- y = -4 y = -4
Plot the resulting coordinate pairs, (-6,-4) and (-2,-4), each time drawing a line that begins at the vertex and passes through one of the points, as shown in Figure 5.9.
Excerpted from The Complete Idiot's Guide to Algebra © 2004 by W. Michael Kelley. All rights reserved including the right of reproduction in whole or in part in any form. Used by arrangement with Alpha Books, a member of Penguin Group (USA) Inc.
You can purchase this book at Amazon.com and Barnes & Noble.