Algebra: Sketching Line Graphs
Sketching Line Graphs
Not that plotting points isn't fun, but it gets old kind of fast. So, let's up the ante and graph some lines, which are only slightly more complicated. Lines are the graphs of linear equations, which are equations that are in this form: ax + by = c. In other words, they're equations that contain x and y (with coefficients attached) and a number without a variable, called a constant.
Back in Solving Basic Equations, you solved simpler linear equations like 2x - 1 = 15; they're simpler because they only have one variable in them. For example, it's pretty easy to figure out that the solution to the equation 2x - 1 = 15 is x = 8. However, when there are two variables present in an equation, a nutty thing happensnow there's not just one solution, but an infinite number of solutions!
Take a look at the linear equation x + y = 9, which translates to "What two numbers add up to 9?" There are many pairs of numbers x and y that could make that statement true. If x = 1 and y = 8, you get 9. How about x = 11 and y = -2? Those two numbers add up to 9 as well! How can you possibly give a solution to this equation when there are so many dang answers?
Talk the Talk
A linear equation has the form ax + by = c, where x and y are variables, a and b are their coefficients, and c is a plain old number with no variable, called a constant. Here are some examples of linear equations: x - y = 5, 3x - 2y = 1, and 4y - 2 = x. (The terms don't always have to be in the same order.)
The best thing to do is to write each set of solutions as an ordered pair and plot them on a graph. For example, given the two solutions I just came up with, I can create the points (1,8) and (11,-2).
Here's the cool thing: All of the solution points, not just the two I pointed out, but all of them, will make a perfectly straight line in the coordinate plane, and that line (since geometry tells us that a line is made up of an infinite number of points) represents the infinite number of solutions to the linear equation. Finally, a math word that makes sense. They're called linear equations because their graphs are lines.
Talk the Talk
Is x = 7 a linear equation? Yes! I know I said a linear equation has the form ax + by = c, and it's true that the equation x = 7 doesn't have any y's in it, so how can it be linear? You can skirt this technicality by saying that b = 0; in other words, the coefficient of y is 0, so there is a y, but there's no use writing it.
If you ever wondered why you had to graph equations, now you know! The graph is just a visual representation of all the ordered pairs (x,y) that, if plugged back into the linear equation, would make it true. Now that you know why you have to make graphs, I'll focus on how to make them.
Graphing with Tables
The easiest way to graph any equation in algebra is to use a table. Basically, you'll plug a whole bunch of numbers in for x and find out what the corresponding y values are to complete the ordered pair. Once you do, you can plot that (x,y) pair on the coordinate plane, secure in the knowledge that it falls on the graph.
Here are the steps to follow to graph a linear equation using a table:
- Solve the equation for y. This makes simplification easier later, and since I just showed you how to do this at the end of last section, why not show off your skill?
- Plug in a few values for x and record the resulting y values. Write each corresponding x and y pair together as a coordinate pair (x,y).
- Plot the points on the coordinate plane and connect them to form the graph. In these early stages of graphing, I suggest you use graph paper. Later on, as you get more experienced, you'll be able to sketch rough graphs without needing as much precision.
Talk the Talk
How many x-values should you plug in? Well, geometry tells us that it takes two points to define a line, but if you plot three, you can use the third one to check yourself. If they don't all fall on the same line, then you made an algebra mistake.
Example 2: Sketch the graph of 2x - y = 5 using a table.
Solution: Solve for y by subtracting 2x from both sides and then either multiplying or dividing both sides by -1 to make y positive.
- -y = -2x + 5
- y = 2x - 5
Now it's time to construct the table. The left column will contain some x values to be plugged in. (I usually choose -1, 0, and 1 since they are small, simple numbers.) The middle column is used to perform the calculations, and the right column is used to record the resulting coordinate pair.
| x | y = 2x - 5 | (x,y) |
| -1 | y = 2(-1) - 5 y = -2 - 5 = -7 | (-1, -7) |
| 0 | y = 2(0) - 5 y = -5 | (0, -5) |
| 1 | y = 2(1) - 5 y = 2 - 5 = -3 | (1, -3) |
Now that you know the points (-1,-7), (0,-5), and (1,-3) are solutions, plot them and connect the dots to get the graph (pictured in Figure 5.5).
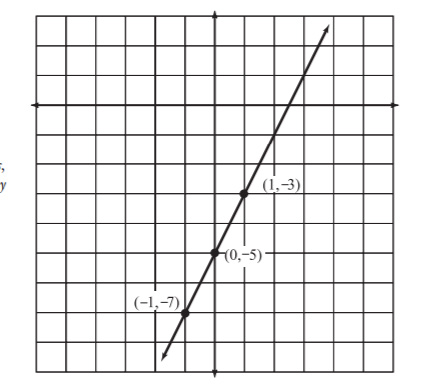
Figure 5.5The line 2x - y = 5 will extend infinitely in each direction. Note that the x-and y-axes do not appear in the exact middle of this graph; since all three of the points occur below the x-axis, I have shifted the focus of my graph there.
You've Got Problems
Problem 2: Sketch the graph of -4x + y = 2 using a table.
Graphing with Intercepts
The spot (or spots) where a graph intersects either the x- or y-axis is called an intercept. You may have noticed, as you practiced plotting points, that coordinates which fall on the axes will always contain a 0 in them. In fact, a coordinate on the x-axis will always have a y-value of 0, and a coordinate on the y-axis will always have an x-value of 0. This makes calculating intercepts easy. All you have to do to find an x-intercept is plug in 0 for y, and to calculate a y-intercept, plug in 0 for x.
Talk the Talk
An intercept is a point on either the x- or y-axis through which the graph passes. Every x-intercept has the form (x,0), and every y-intercept has the form (0, y).
Usually, plugging in 0 for a variable makes students happy, because anything multiplied by that 0 will vanish. So, it's not a very burdensome task. Even better, once you've found those two intercepts, you can plot them and connect the dots to find the graph of the line!
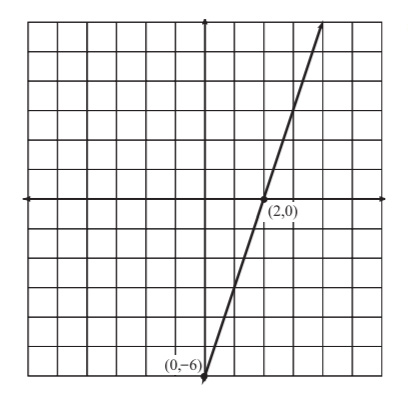
Figure 5.6The solution to Example 3, the graph of 3x - y = 6.
Example 3: Graph 3x - y = 6 by calculating its intercepts.
Talk the Talk
Problem 3: Graph 4x + 2y = -8 by calculating its intercepts.
Solution: If you plug in 0 for x and solve, you'll get the value of the y-intercept.
- 3(0) - y = 6
- -y = 6
- y = -6
The y-intercept is (0,-6). Now plug 0 in for y (back in the original equation) and solve to get the value of the x-intercept.
- 3x - (0) = 6
- 3x = 6
- x = 2
The x-intercept is (2,0). Plot the two intercepts and connect the dots to get the graph, pictured in Figure 5.6.
Excerpted from The Complete Idiot's Guide to Algebra © 2004 by W. Michael Kelley. All rights reserved including the right of reproduction in whole or in part in any form. Used by arrangement with Alpha Books, a member of Penguin Group (USA) Inc.
You can purchase this book at Amazon.com and Barnes & Noble.